A guest post by Joao Pita Costa from Quintelligence

Fig 1 – Word cloud putting together several key concepts related with public health, and representing the data visualisation of text used in day-to-day basis.
With the age of data analytics and visualisation positively affecting the daily life of people worldwide, health professionals are also profiting from the access to efficient technological tools to better profit from that advantage. The day-to-day growth of knowledge available online raises the need of complete and reliable information sources. A particular example of this is PubMed, a central reference to state-of-the-art in medical research. This tool is frequently used to have an overview of a certain topic using several filters, tags and advanced search options. PubMed is freely available since June 1997, providing access to references and abstracts on life sciences and biomedical topics. MEDLINE is the underlying open database, maintained by the United States National Library of Medicine (NLM) at the National Institutes of Health. It includes citations from more than 5,200 worldwide journals in about 40 languages (about 60 languages in older journals). As of 11 April 2017, PubMed has more than 27 million records dating from 1946 to the present. About 500,000 new records are added each year. 17.2 million of PubMed’s records are listed with their abstracts, and 16.9 million articles have links to full-text, of which 5.9 million articles have full-text available for free online. In particular, it includes 443218 full-text articles with the key-words string “public health”.

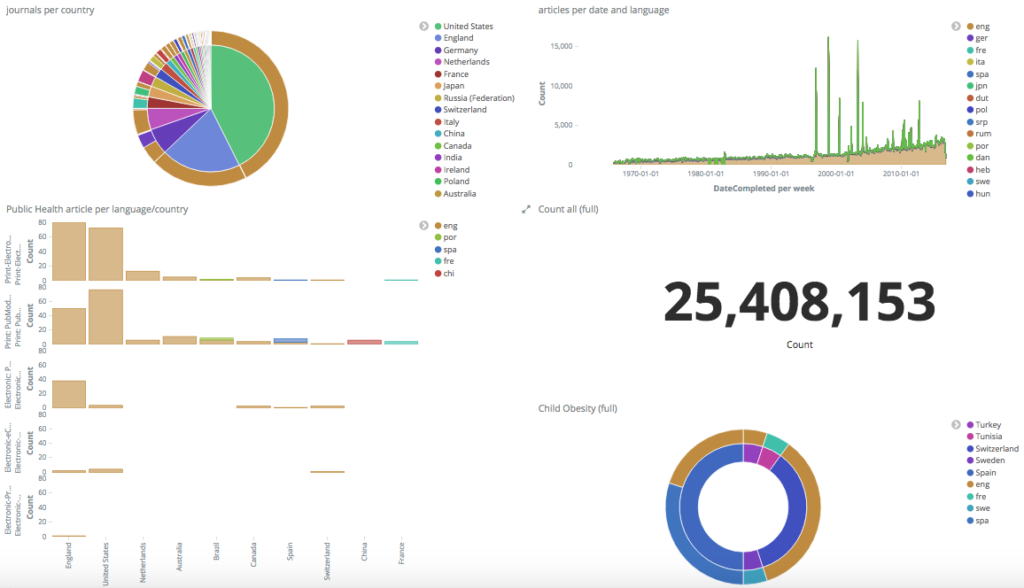
Figure 2. MIDAS data visualisation tool enabling exploration of the MEDLINE dataset in its full potential, based on pie charts and other representations easy to understand and to communicate (a live demo is available at http://midas.quintelligence.com/).
The richness of such a complete data source brings challenges, particularly in the efficient search and choice of appropriate scientific knowledge. The manipulation and visualization of complex data is an important step to extract meaningful information from a dataset such as MEDLINE. In that, MIDAS offers a data visualisation tool based on the powerful open source search engine Elasticsearch . This tool enables one to query large datasets and produce different types of visualisation modules that can be later integrated into customised dashboards. The flexibility of such dashboards permits the user to profit of data visualisations that feed on his/her preferences, previously set up as filters to the dataset. MIDAS data visualisation tool permits the user to explore the potential of the MEDLINE dataset, based on pie charts and other representations easy to understand and to communicate.
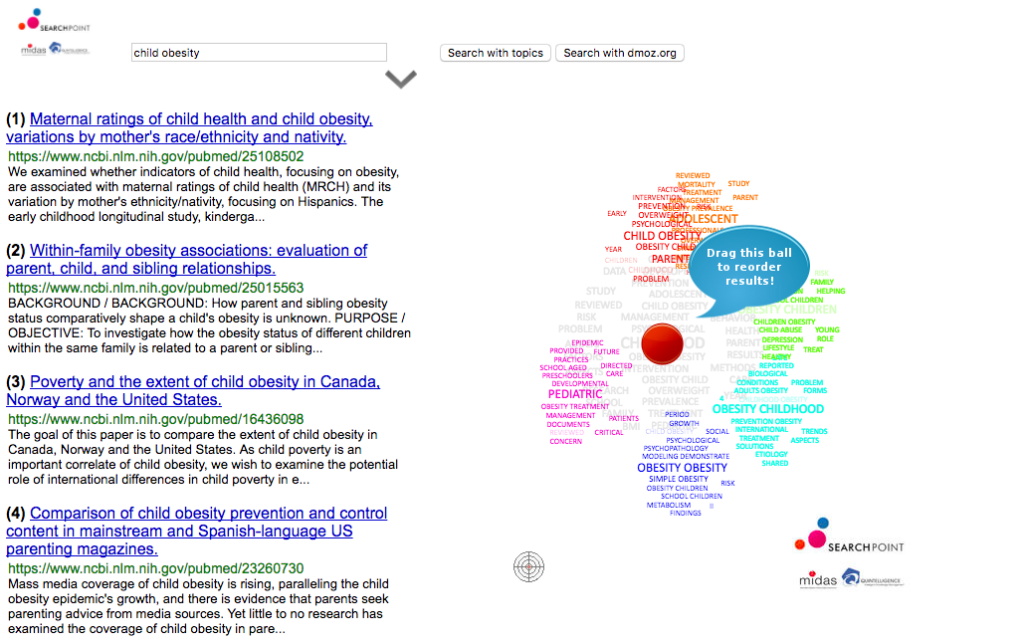
When we use indexing services, such as the one described above or most internet search engines, to search for information across a huge amount of text documents we usually receive the answer as a list sorted by a relevance criteria defined by the search engine. The answer we get is biased by definition and what we see is a “surface of an iceberg”. We could try refining the query further, but even by applying this time-consuming procedure, we can never be confident about the quality of the result. For this reason MIDAS is developing an interactive visual tool based on the SearchPoint technology (searchpoint.ijs.si) that helps surfacing the information we are looking for. It summarizes the results of an indexing service and allows users to interactively explore its results based on topics extracted from their textual snippets. After performing the search over MEDLINE, by representing documents in clustered topics represented as word-clouds, it identifies a handful of grouped keywords representing different topics. In Figure 3 those groups (right) are represented by different colors.

Fig 3 – MIDAS data exploration interactive tool that helps surfacing information that one is looking for by redoing the prioritization in the search index output.
By moving a pointer closer to one of the clusters, the results are reordered, promoting the documents related to that group to the top of the list. This allows efficient exploration of the medical domain by interactively surfacing relevant information and avoiding the standard answer which is biased by definition. For instance, when querying the portal against “childhood obesity”, related articles are presented as five groups related to different topics that experts discuss when describing the issue. By moving the position of the point over the colored groups, the order of results changes accordingly. As shown in Figure 3, the item that was originally at position 111 now occupies the second position and the item from the 154th now occupies the 4th position due to their relevance to the group of interest. Quintelligence is further developing this technology to enable a visual representation of a significant part of the selected documents originated from the search results, permitting a view of the knowledge coverage through multidimensional scaling over a certain research topic.
The MEDLINE dataset includes a comprehensive controlled vocabulary – the Medical Subject Headings (MeSH) – with the purpose of indexing journal articles and books in the life sciences. It is very useful in the search of specific topics in medical research, with particular interest when starting a scientific review before engaging into a particular research topic. MeSH is composed of 16 major categories (covering anatomical terms, diseases, drugs, etc) that further subdivide from most general to most specific in up to 13 hierarchical levels. This rich data structure is annotated by human hand, assisted by semi-automated NIH tools, and therefore is not available in the most recent citations. Though, the Quintelligence team in the context of the MIDAS project is making available an automated classifier that is able to suggest the categories of the not yet annotated articles. It learns over the part of the MEDLINE dataset that is annotated with MeSH, and will be able to suggest categories to the submitted text snippets. These can be abstracts that do not yet include MESH classification, medical summary records or even health related news articles.

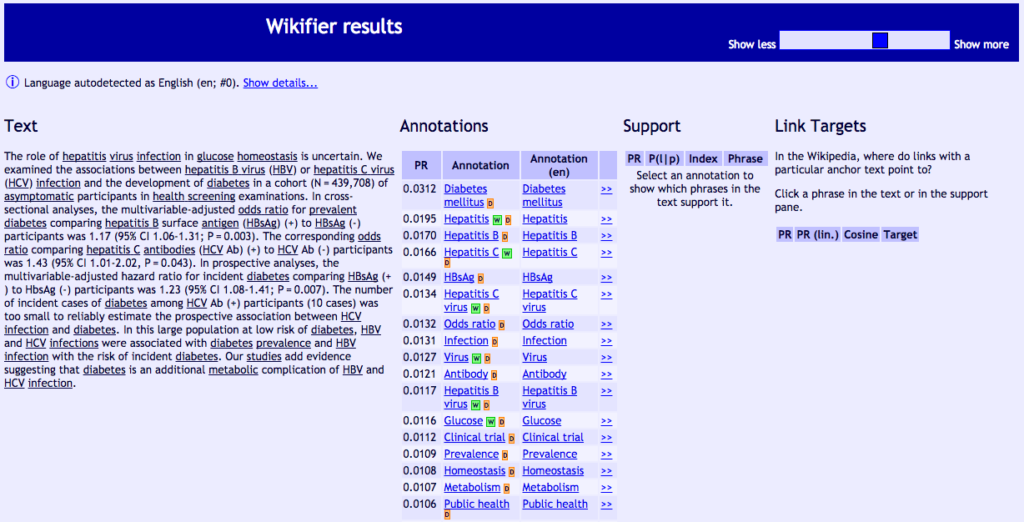
Fig 4 – The data annotation of free text based on an underlying ontology of concepts and entities that reflect the online knowledge shared in Wikipedia.
The rising importance of automatic annotation based on open bodies of knowledge such as Wikipedia or MEDLINE/MeSH can be very useful both to health professionals and policy-makers. Wikipedia is the biggest open, online and up-to-date knowledge repository on the internet, and there have been many initiatives to leverage the accumulated knowledge for several application domains. For example, DBPedia is the the largest, open, multilingual knowledge graph available. Knowledge graphs are a basis for many modern applications of artificial intelligence and advanced analytical methods. Another area of usage is the automatic annotation of texts with wikipedia concepts (“wikfying of texts”), which can then lead to the extraction of knowledge and better text understanding by both machines and humans. The text annotation tool Wikifier (wikifier.ijs.si) is another example of technology allowing for the annotating large quantities of free text in a very short time. The user can submit a snippet of text and run the automated annotation over the loaded text. The output is the input text with underlined identified concepts with links to relevant Wikipedia concepts, pagerank level (PR) and other metrics to deal with disambiguation based on content.
The usage of text data goes beyond static summary reports when the user is able to manipulate dynamic representations of data sources such as MEDLINE, in a visual way that is fit to his/her workflow and topics of interest. It is particularly useful when it can complement the user’s own data, to highlight insights that were overseen, or to save time in tasks that are usually exhausting when done through classical methods. MIDAS permits that such technology is available. Added value is given by the fact that such advanced tools are being developed together with health professionals and policy-makers making of its potential a meaningful technology.
