
A guest post by Brian Cleland from Ulster University

A key focus of the MIDAS Project is ensuring that the information delivered by the MIDAS platform is relevant and actionable, and to this end the consortium has adopted a user-centred design ethos. A broad selection of experts from a diverse spectrum of backgrounds have been chosen in order to effectively capture user needs and provide realistic engagement in the co-design of the system. This approach has been driven by a realisation that ultimate users of the system are likely to be very diverse, and will include stakeholders with very different backgrounds and levels of technical knowledge.
The MIDAS platform will include technical components to enable the collection and preparation of heterogeneous data, and an agreed architecture for data storage, data integration, data virtualisation, data cleansing, deployment and management. The platform will also incorporate a variety of tools and algorithms that will allow meaning to be extracted from data, building on existing machine learning and other analytics methods. From the user’s perspective, a key part of the platform will be the user interface (UI) layer that will draw aggregated outputs from the analytics layer for display via management dashboards and easy-to-use interactive tools (see Fig. 1).
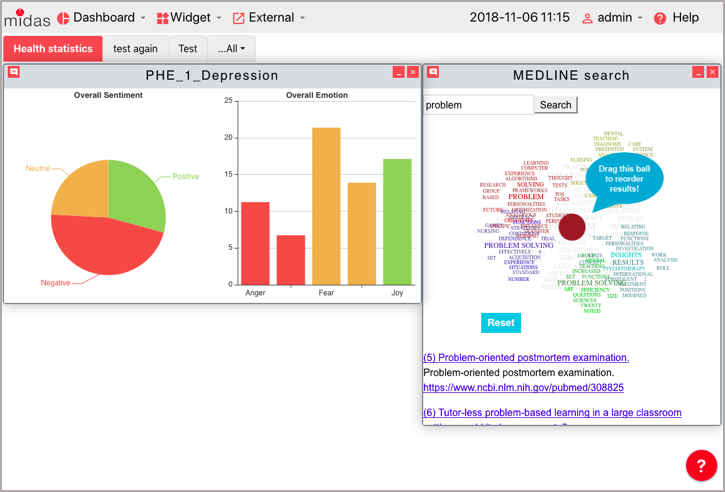
Fig. 1. MIDAS Dashboard with example widgets
This first stage of the usability testing was to carry out a heuristic evaluation, which involves an expert using a series of established usability and design principles to audit the user interface. In this case, Ulster University UX lab experts used well-established usability principles such as Jakob Nielsen’s 10 heuristics [1], laws from Gestalt psychology [2] and the 8 golden rules by Ben Shneiderman [3]. The test team included three specialists with extensive experience of UX testing. Following the evaluation, usability issues were set out in a series of slides for sharing with the development team. These slides also included suggestions to improve the system. Most findings were addressed according to the suggestions prior to the formative evaluation taking place.
For the formative evaluation a number of subjects were recruited to attempt a series of tasks using the MIDAS prototypes. It had been agreed at the outset of the MIDAS Project that the platform would tested and validated with real data and representative users of the system from across the partner countries. Twelve users in total were selected from the Basque Country, Finland, Northern Ireland and Republic of Ireland. These users were from a diverse range of technical and policy backgrounds. Although the final test protocol (see below) focused primarily on two main user personas – a data scientist and a policy-maker, it was decided that each user should perform the tasks associated with both personas in order to maximise data collection.
A rigorous test protocol was jointly developed by consortium members, led by usability testers from Ulster University’s UX Lab. The usability testing protocol was informed by Ulster’s UX-Lab having carried out a range of usability tests on medical devices, software and data visualisations (see Fig. 2). Each subject attempted the task whilst ‘thinking-aloud’. Before and after each task, the user was asked how difficult they expected the task to be and how difficult the task was, thus measuring whether the system met the user’s expectation. This is known as the Single Ease Question (SEQ) [4]. A questionnaire based on the System Usability Scale (SUS) [5] was also given to each user in order to measure perceived usability. In addition, after the usability test, we measured the frequency of usability errors/issues, task completion rates, and task completion times.
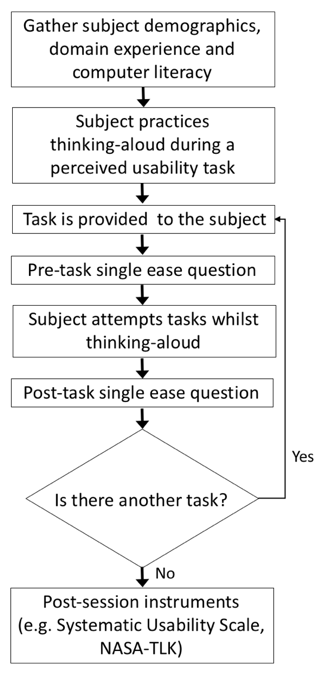
Fig. 2. Typical usability testing protocol.
The user-centred formative evaluation phase involved a variety of users from different backgrounds carrying out task associated with two key user personas – the Data Scientist and Policy Maker. The findings showed that there was very little overlap in results compared to the heuristic evaluation. Task completion times were generally satisfactory, and the Single Ease Questions (SEQ) for the tasks showed that overall the system was slightly easier to use than most users had anticipated. Both the SEQ and the System Usability Scale (SUS) results indicated that the application was harder to use from a Policy Maker perspective, compared to a Data Scientist perspective.
The qualitative results, which enabled the testers to identify key issues that were common to all testing sites. These included the need for more metadata and guidance via the user interface, which many users initially found somewhat confusing. In addition, the underlying datasets meant that users often required help in understanding the information they were attempting to use. Another challenge was raised by one user who had already built up significant experience of an alternative dashboard-based analytics product, and the UX paradigm adopted by the MIDAS platform did not align with prior expectations. Ultimately, the researchers were able to achieve a compromise proposal in terms of how dashboards should be presented to users.
While the task completion times, SEQ scores and SUS scores were useful for generating quantitative usability measures, it is worth noting that the most valuable feedback for the development team came from the qualitative feedback. This qualitative approach and analysis of user comments as they spoke about their experience using the platform provided the most valuable insights in terms of determining how ongoing development work should be targeted. This is perhaps reflective of the fact that software usability is by its nature a complex construct, requiring a depth of analysis that can only come from a qualitative approach.
It should be borne in mind that this evaluation study of the MIDAS platform was focused on an early prototype, which entailed incomplete functionality and limited access to client data. For future iterations of the platform and usability testing, it is anticipated that the functionality of the application will be significantly extended, and a richer ecosystem of datasets will be available for analysis. Future test protocols will be adapted to focus on the specific needs of each MIDAS pilot site, and are expected to involve a richer user interface that will include external data sources and visualisation tools.
References
- Nielsen, J.: 10 usability heuristics for user interface design. Nielsen Norman Group, 1(1). (1995)
- Mazumder, F. K., & Das, U. K.: Usability guidelines for usable user interface. International Journal of Research in Engineering and Technology, 3(9), 79-82. (2014)
- Shneiderman, B.: Designing for fun: how can we design user interfaces to be more fun?. interactions, 11(5), 48-50. (2004)
- Sauro, J.: 10 things to know about the Single Ease Question (SEQ). Measuring U, (2012)
- Finstad, K.: The system usability scale and non-native english speakers. Journal of usability studies, 1(4), 185-188. (2006)